Total Overview Dashboard Pivot Point Workflow
The Total Overview Dashboard is the gateway and pivot point for other dashboards. The Total Overview dashboard is the main dashboard that allows the analyst to create 5-tuple searches, view aggregated inbound and outbound bytes, source and destination cluster map, top source, and destination ips and ports, along with top talkers. It also provides a total overview of DNS, Flows, TLS, SMB, Files, DHCP, DHCPv6, HTTP, Emails, Active triggers, and Alert logs. This interactive dashboard that allows deep drill down into each log category for further investigation.


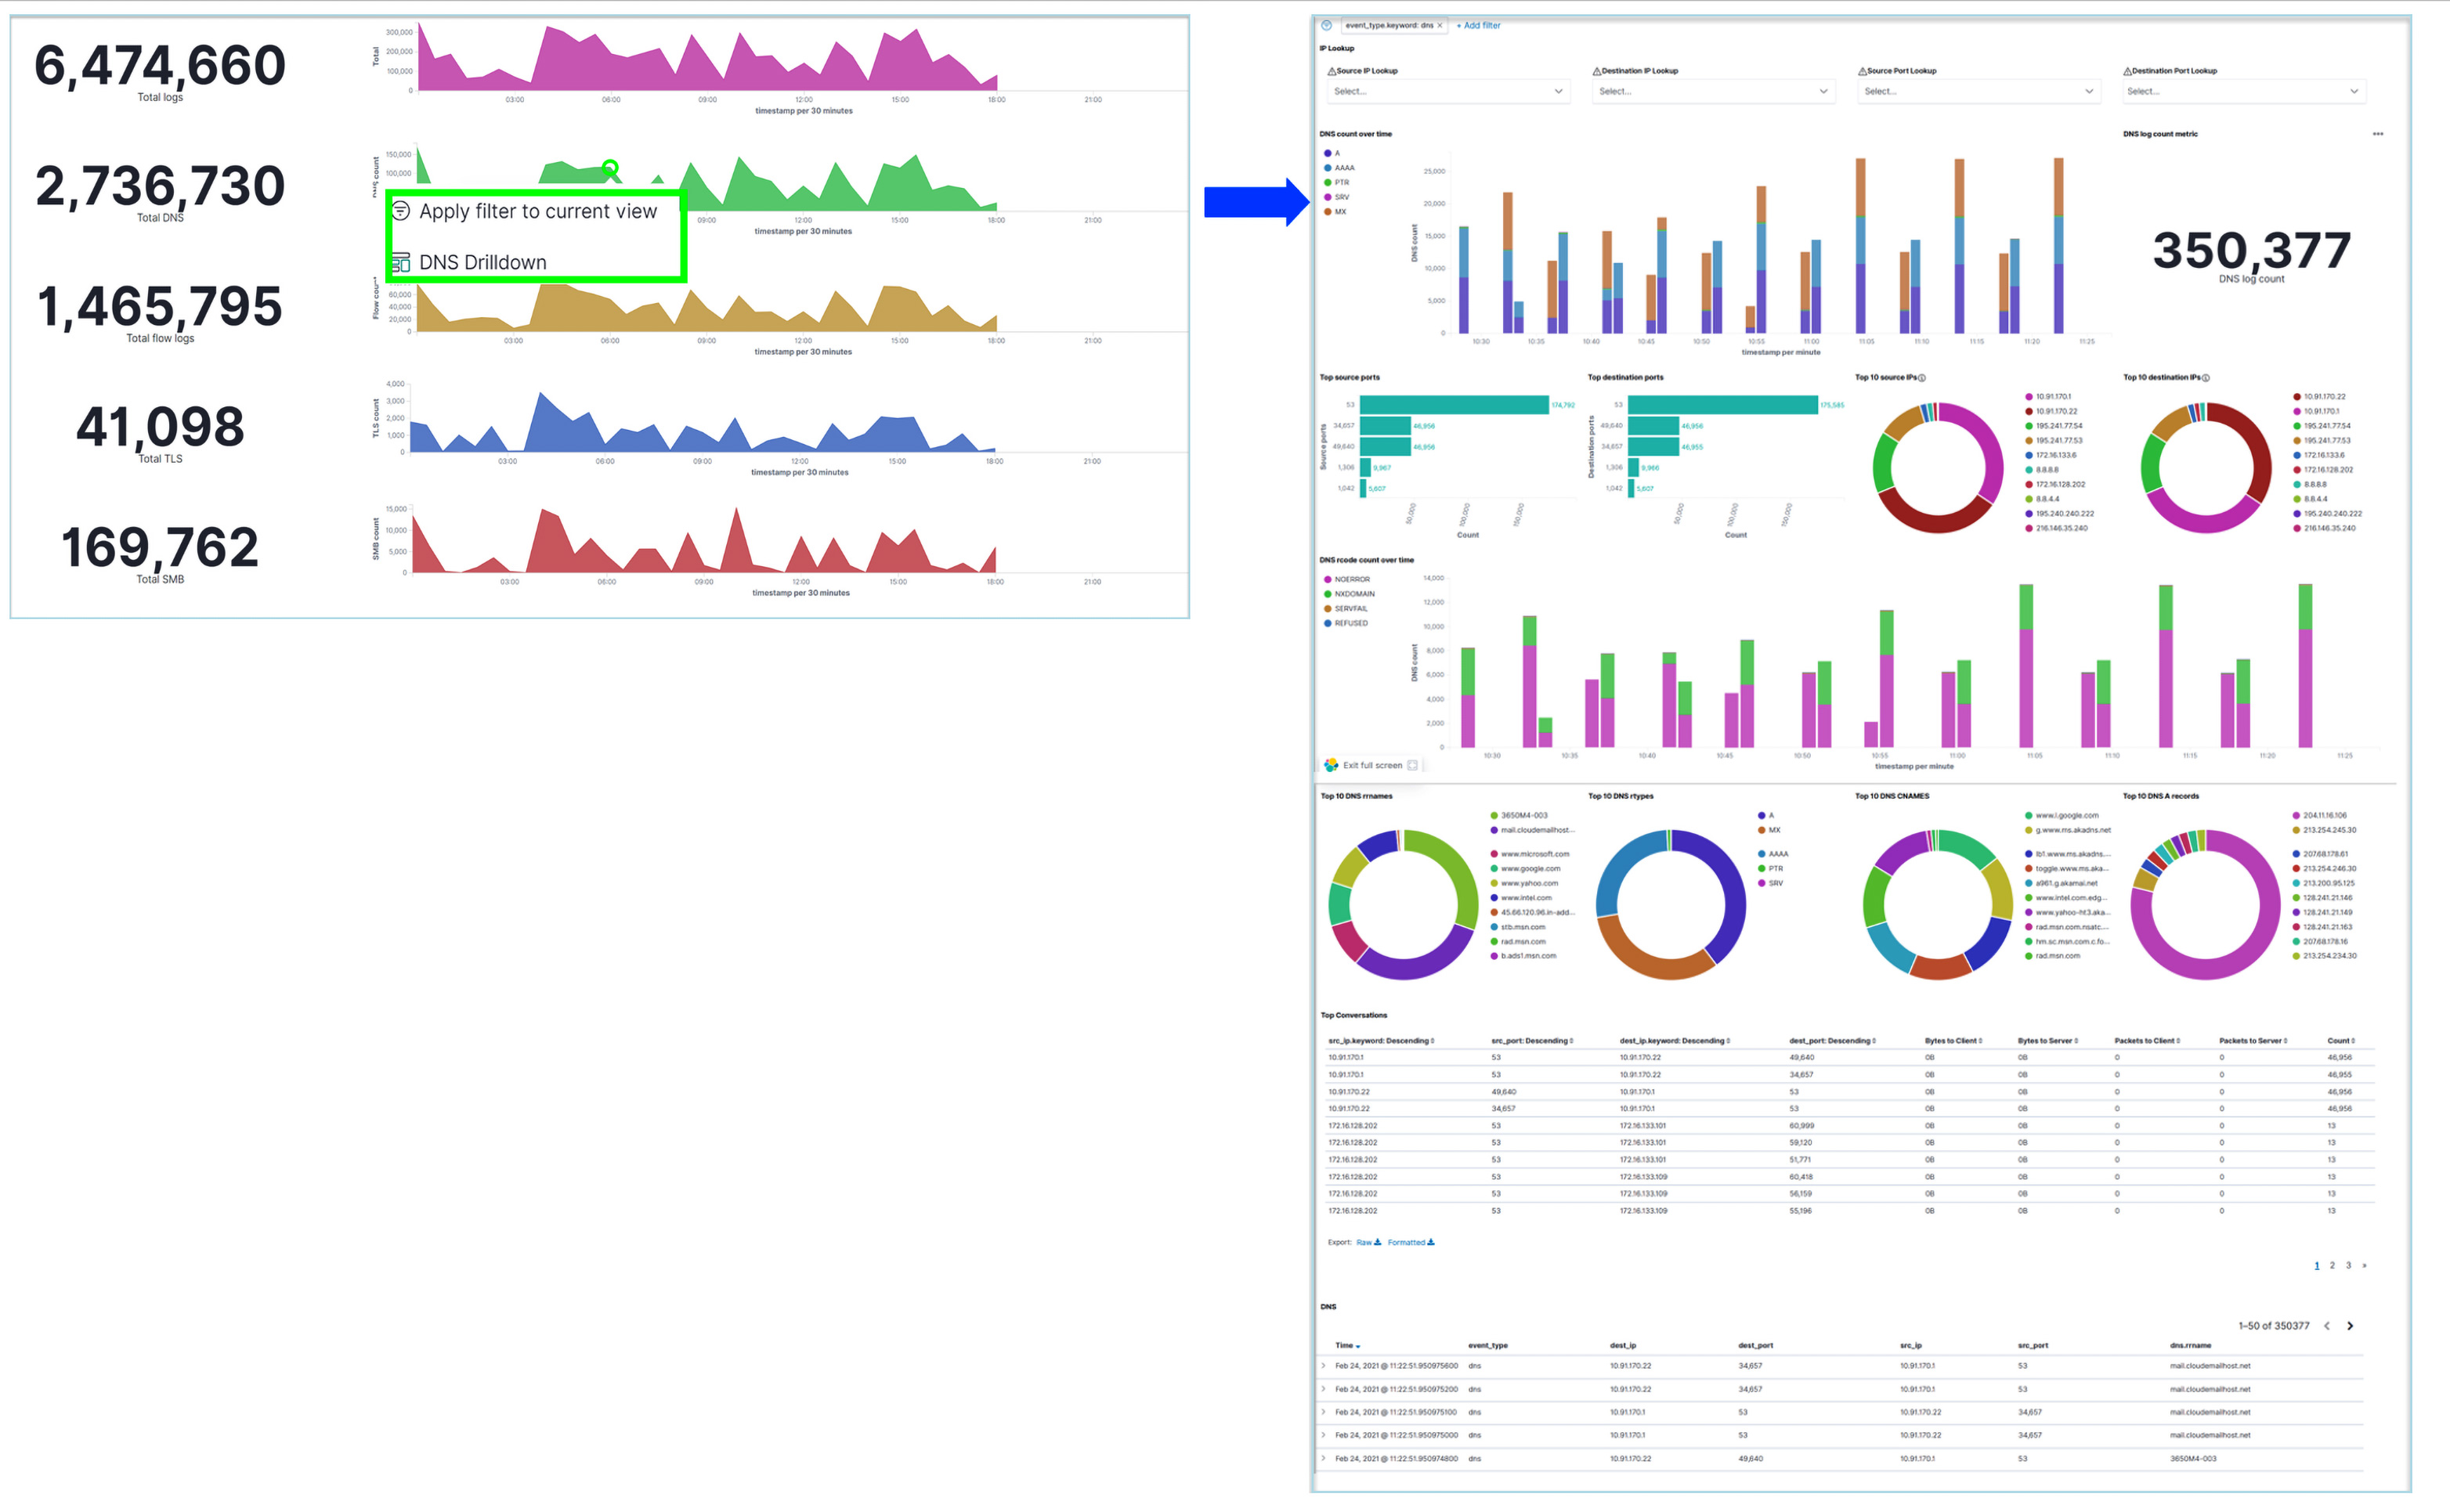
Drilling down into specific network events
For in-depth investigation and analysis, the analyst can click on a log graph and select the drill down option. This pivots to a more detailed visualization of the selected log. For example, a DNS drilldown is shown below. User can do similar drilldowns for other log events to access there individual, detailed dashboard via the Total Overview dashboard.